Searching for a shell
The Density Overlap Regions Indicator (DORI) with VASP
The Density Overlap Regions Indicator (DORI) provides a compromise between the ![]() Electron Localization Function) which highlights the strong electron locatlization, indicating the existance of covalent bonds or lone pairs and the
Electron Localization Function) which highlights the strong electron locatlization, indicating the existance of covalent bonds or lone pairs and the ![]() Non-Covalent Interaction Index) which identifies the weak electron localization (and delocalization) of electrons like van der Waals interactions and steric repulsion.
Non-Covalent Interaction Index) which identifies the weak electron localization (and delocalization) of electrons like van der Waals interactions and steric repulsion.
To define DORI (![]() 10.1021/ct500490b) we first need to define a dimensionless quantity $\theta$:
10.1021/ct500490b) we first need to define a dimensionless quantity $\theta$:
where $\mathbf{k}(\mathbf{r})$ is the local momentum vector, defined as:
In covalent bonding regions, the density is characterized by the small density gradients, especially at the bond critial points where $\nabla \rho(\mathbf{r}) = 0$. In this case, both the nominator and the denominator of $\theta$ are zero, but since the denominator goes to zero faster, $\theta$ will go to $+\infty$.
To tame this divergent behavior, the DORI is defined as:
so that its a scalar field with a value between $0$ and $1$ where $1$ indicates the potential existance of a chemical bond or interactions.
Using VASP’s CHGCAR file, we can use our previous central finite difference method to calculate gradient of the density. As a result, for Benzene, the following DORI plot was obtained.
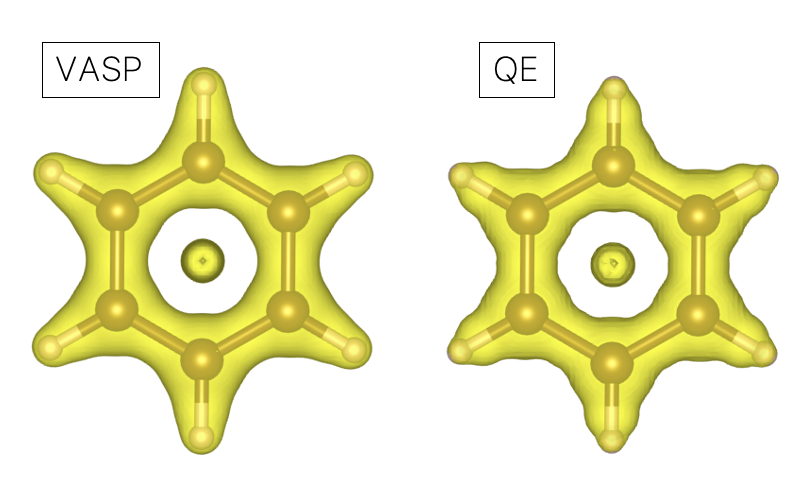
We see that our finite difference result looks almost identical to the result obtained with QE’s pp.x. Note that these results have subtle differences near the core regions comparing to the RDG calculated using all-electron code like ADF (see Fig. 3(a) of ![]() 10.1021/ct500490b). This is probably caused by use of pseudopotentials.
10.1021/ct500490b). This is probably caused by use of pseudopotentials.
Similar to the ![]() Non-Covalent Interaction Index, DORI can also be color-coded using $\mathrm{sign}(\lambda_2)\rho(\vec r)$ where $\lambda_2$ is the middel eigenvalue of the Hessian of the charge density. For Benzene:
Non-Covalent Interaction Index, DORI can also be color-coded using $\mathrm{sign}(\lambda_2)\rho(\vec r)$ where $\lambda_2$ is the middel eigenvalue of the Hessian of the charge density. For Benzene:
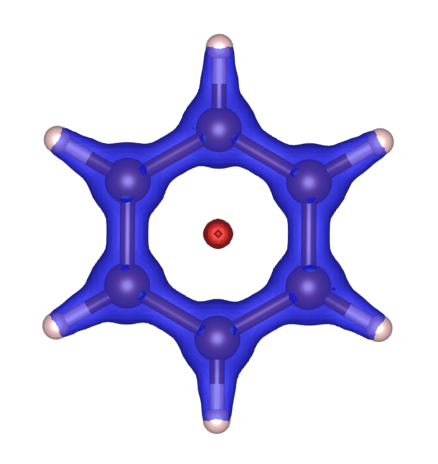
We can clearly see that in the middle of the Benzene molecule, there is a high value DORI pocket but the intraction corresponding to that pocket repels electrons (red color - positive eigenvalue of the Hessian). This result suggests that at the center of the Benzene molecule exists a strong steric repulsion. The blue regions near the molecule, on the other hand, corresponds to the strong electron attraction caused by covalent bonding.
As described at the beginning, DORI can also be used to visualize the weak non-covalent interactions. To demonstrate this, I’ve put two Benzene molecules together. Their calculated DORI plot is:
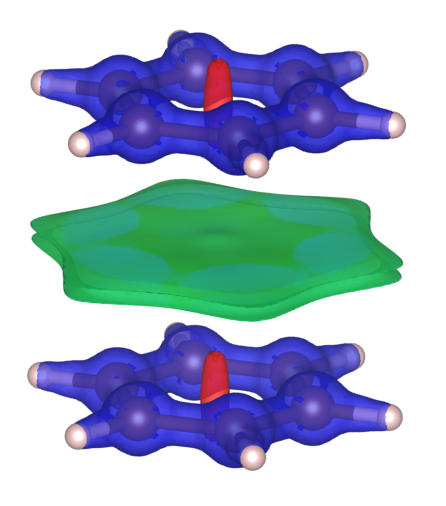
This plot is almost identical to Fig. 4(e) in ![]() 10.1021/ct500490b. Apart from the regions near the molecules which are similar to our previous results, between two Benzene molecule, there’s another region with weak interactions (indicated by the color green). This should be attributed to the weak van der Waals interactions between Benzene molecules.
10.1021/ct500490b. Apart from the regions near the molecules which are similar to our previous results, between two Benzene molecule, there’s another region with weak interactions (indicated by the color green). This should be attributed to the weak van der Waals interactions between Benzene molecules.
The code to generate these results can be found: ![]() DORI.tar.gz.
DORI.tar.gz.
To obtain these results:
- run VASP using the files from
vasp_input.tar.gz - run
DORI.pyand analyzeELFCAR_DORI.vasp. - run
hessian.pyand plot the color RDG usinghess_color.vaspandELFCAR_DORI.vasp.